Image
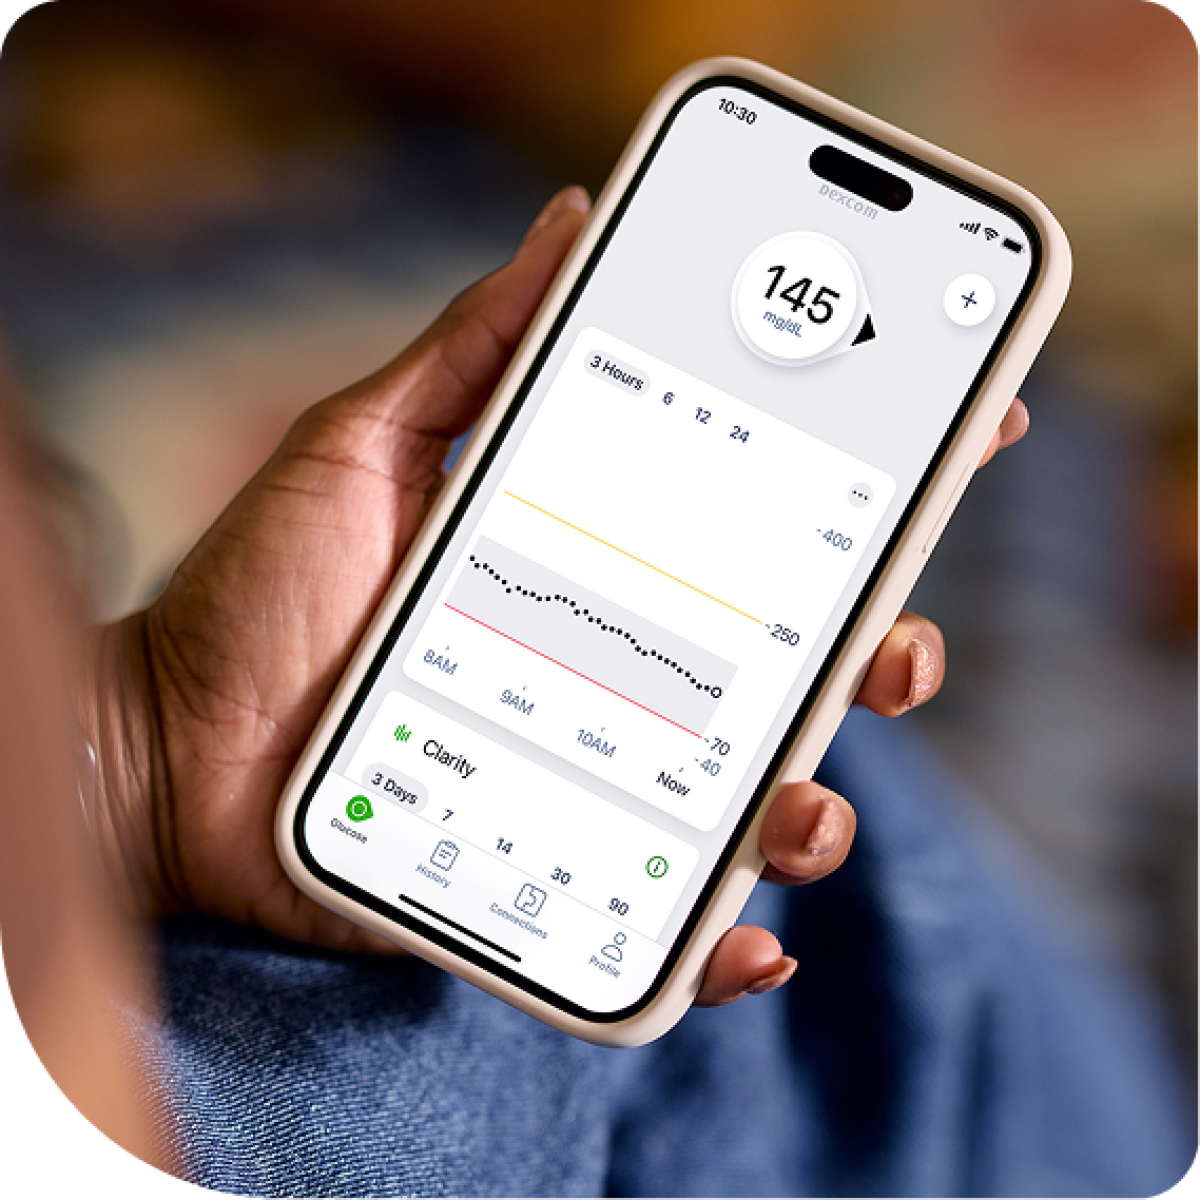
Explore new Overview and Daily views that give Dexcom G7 users easier access to retrospective glucose insights.
This resource is intended for educational purposes only for healthcare providers practicing in the United States. It does not constitute medical advice and is not a substitute for professional judgment or individualized patient care.
The enhanced Trends tab in the Dexcom G7 app brings additional retrospective CGM reports and metrics directly into the app, with Overview and Daily views that help users explore glucose patterns over time. For HCPs, the update creates an opportunity to reinforce the glucose metrics discussed during visits and help patients understand where to find similar information on their own.
The enhanced Trends tab gives Dexcom G7 users easier access to retrospective glucose information directly within the app. Previously, users who wanted to explore more comprehensive CGM reports may have moved between the Dexcom G7 app and Dexcom Clarity. The enhanced Trends experience brings additional metrics and reports together in the G7 app, making it easier to move from the current glucose value to a broader view of glucose patterns.
The information is organized into two complementary views: Overview provides a broader look at glucose metrics and patterns over time, while Daily offers a closer look at an individual day. Together, they give users different ways to put individual glucose values into context and begin exploring broader patterns.
For HCPs, that creates an educational opportunity. Many of the metrics patients can now see within Trends may already be part of conversations during office visits or CGM data reviews. An HCP discussing Time in Range, for example, can show a patient where that metric appears within the Trends tab so the patient can continue to reference it after the appointment.
More glucose information does not necessarily mean every metric will have equal relevance for every patient. HCPs can help patients understand what individual metrics mean, which may be most useful to follow, and how different measures contribute to a broader picture of their glucose patterns.
The result is another way for clinicians and patients to discuss CGM data together, while giving patients easier access to retrospective information between visits.

Users can review glucose trends across days, weeks, and months directly within the Dexcom G7 app.
The enhanced Trends tab introduces more ways for users to look back at their CGM data directly within the Dexcom G7 app, from broad patterns across several months to the details of a single day.
Overview summarizes key glucose metrics across 3, 7, 14, 30, or 90 days. Time in Range and sensor usage are displayed, while additional metrics can be personalized to include average glucose, GMI, Average Day, logged insulin, post-meal glucose, fasting glucose, and glucose variability.
Time in Range can be viewed using the default 70–180 mg/dL range or a customized target range.
The Average Day graph combines glucose data from all days within the selected timeframe into one 24-hour view, making recurring glucose averages and patterns easier to see.
Daily provides a more detailed view of an individual day, including Time in Range, sensor usage, average glucose, glucose variability, the glucose history graph, and logged events. Users can look back at individual days for up to 180 days.
Logged events appear alongside glucose history, providing additional context when reviewing a particular day. When enabled, activity information from Apple Health or Google Health can also appear in the Daily view. Apple Health information may include steps, active minutes, and active energy.
Metrics such as Time in Range, average glucose, GMI, glucose variability, and sensor usage offer different perspectives on glucose patterns over time.
The opportunity, however, is not simply to give patients more numbers. HCPs can help patients understand which metrics are relevant to them, what those metrics mean, and how the Overview and Daily views can provide additional context for the glucose information they see.

The enhanced Trends experience gives healthcare providers new opportunities to discuss glucose data in context.
The enhanced Trends experience is relevant for patients using the Dexcom G7 app who may benefit from reviewing glucose patterns and retrospective CGM information within the app.
Patients may benefit from education not only on where to find the information, but also on what it means. A simple way to explain the two views is that Overview answers, “How have things been going over time?” while Daily answers, “What happened on this particular day?”
HCPs can help patients understand metrics such as Time in Range, average glucose, GMI, glucose variability, and sensor usage and discuss which may be most useful for them to follow. The Average Day graph may also require some explanation, particularly how data from multiple days are combined into a single 24-hour view.
HCPs can also discuss individualized glucose targets with patients and show them how their target range is reflected in the Dexcom G7 app. Time in Range can be viewed using either the default 70–180 mg/dL range or a customized target range.
Patients can also be shown how logged events and activity information can provide additional context when reviewing an individual day.
The Trends tab provides another opportunity to reinforce CGM education during and after an appointment.
For example, an HCP reviewing CGM data in Dexcom Clarity might discuss Time in Range with a patient, then show the patient where Time in Range appears in the Trends tab of their G7 app. That gives the patient a familiar metric they can continue to reference after the visit.
This may help extend CGM education beyond the appointment by making information discussed during the visit easier for patients to revisit later.
The different views can be used together to move from a broader glucose pattern to a closer look at specific days for additional context.
Overview can help identify a broader pattern; Average Day can help reveal how patterns recur across a 24-hour period; and Daily can provide a closer look at individual days and logged events.
For HCPs, the opportunity is to help patients understand when each view may be useful and how individual metrics fit into the larger glucose picture.
The enhanced in-app reports provide an additional way for patients and HCPs to look at glucose information together, but Dexcom Clarity continues to offer more comprehensive options for clinical CGM review, including AGP, Patterns, Trends, Daily, Compare, and Statistics reports.